
Analytics — Governance
For: Security teams and platform operators monitoring policy enforcement, anomalies, and review queues.
Operations Overview | Analytics Overview | Analytics → Spend | Analytics → Governance | Govern → Budgets | Scheduled Reports
The Governance page provides a security-focused view of gateway activity: denial rates, pending approvals, quarantined requests, and automated cost anomaly detection.
Required: Core Platform package.
Navigation: console.axemere.ai/analytics/governance
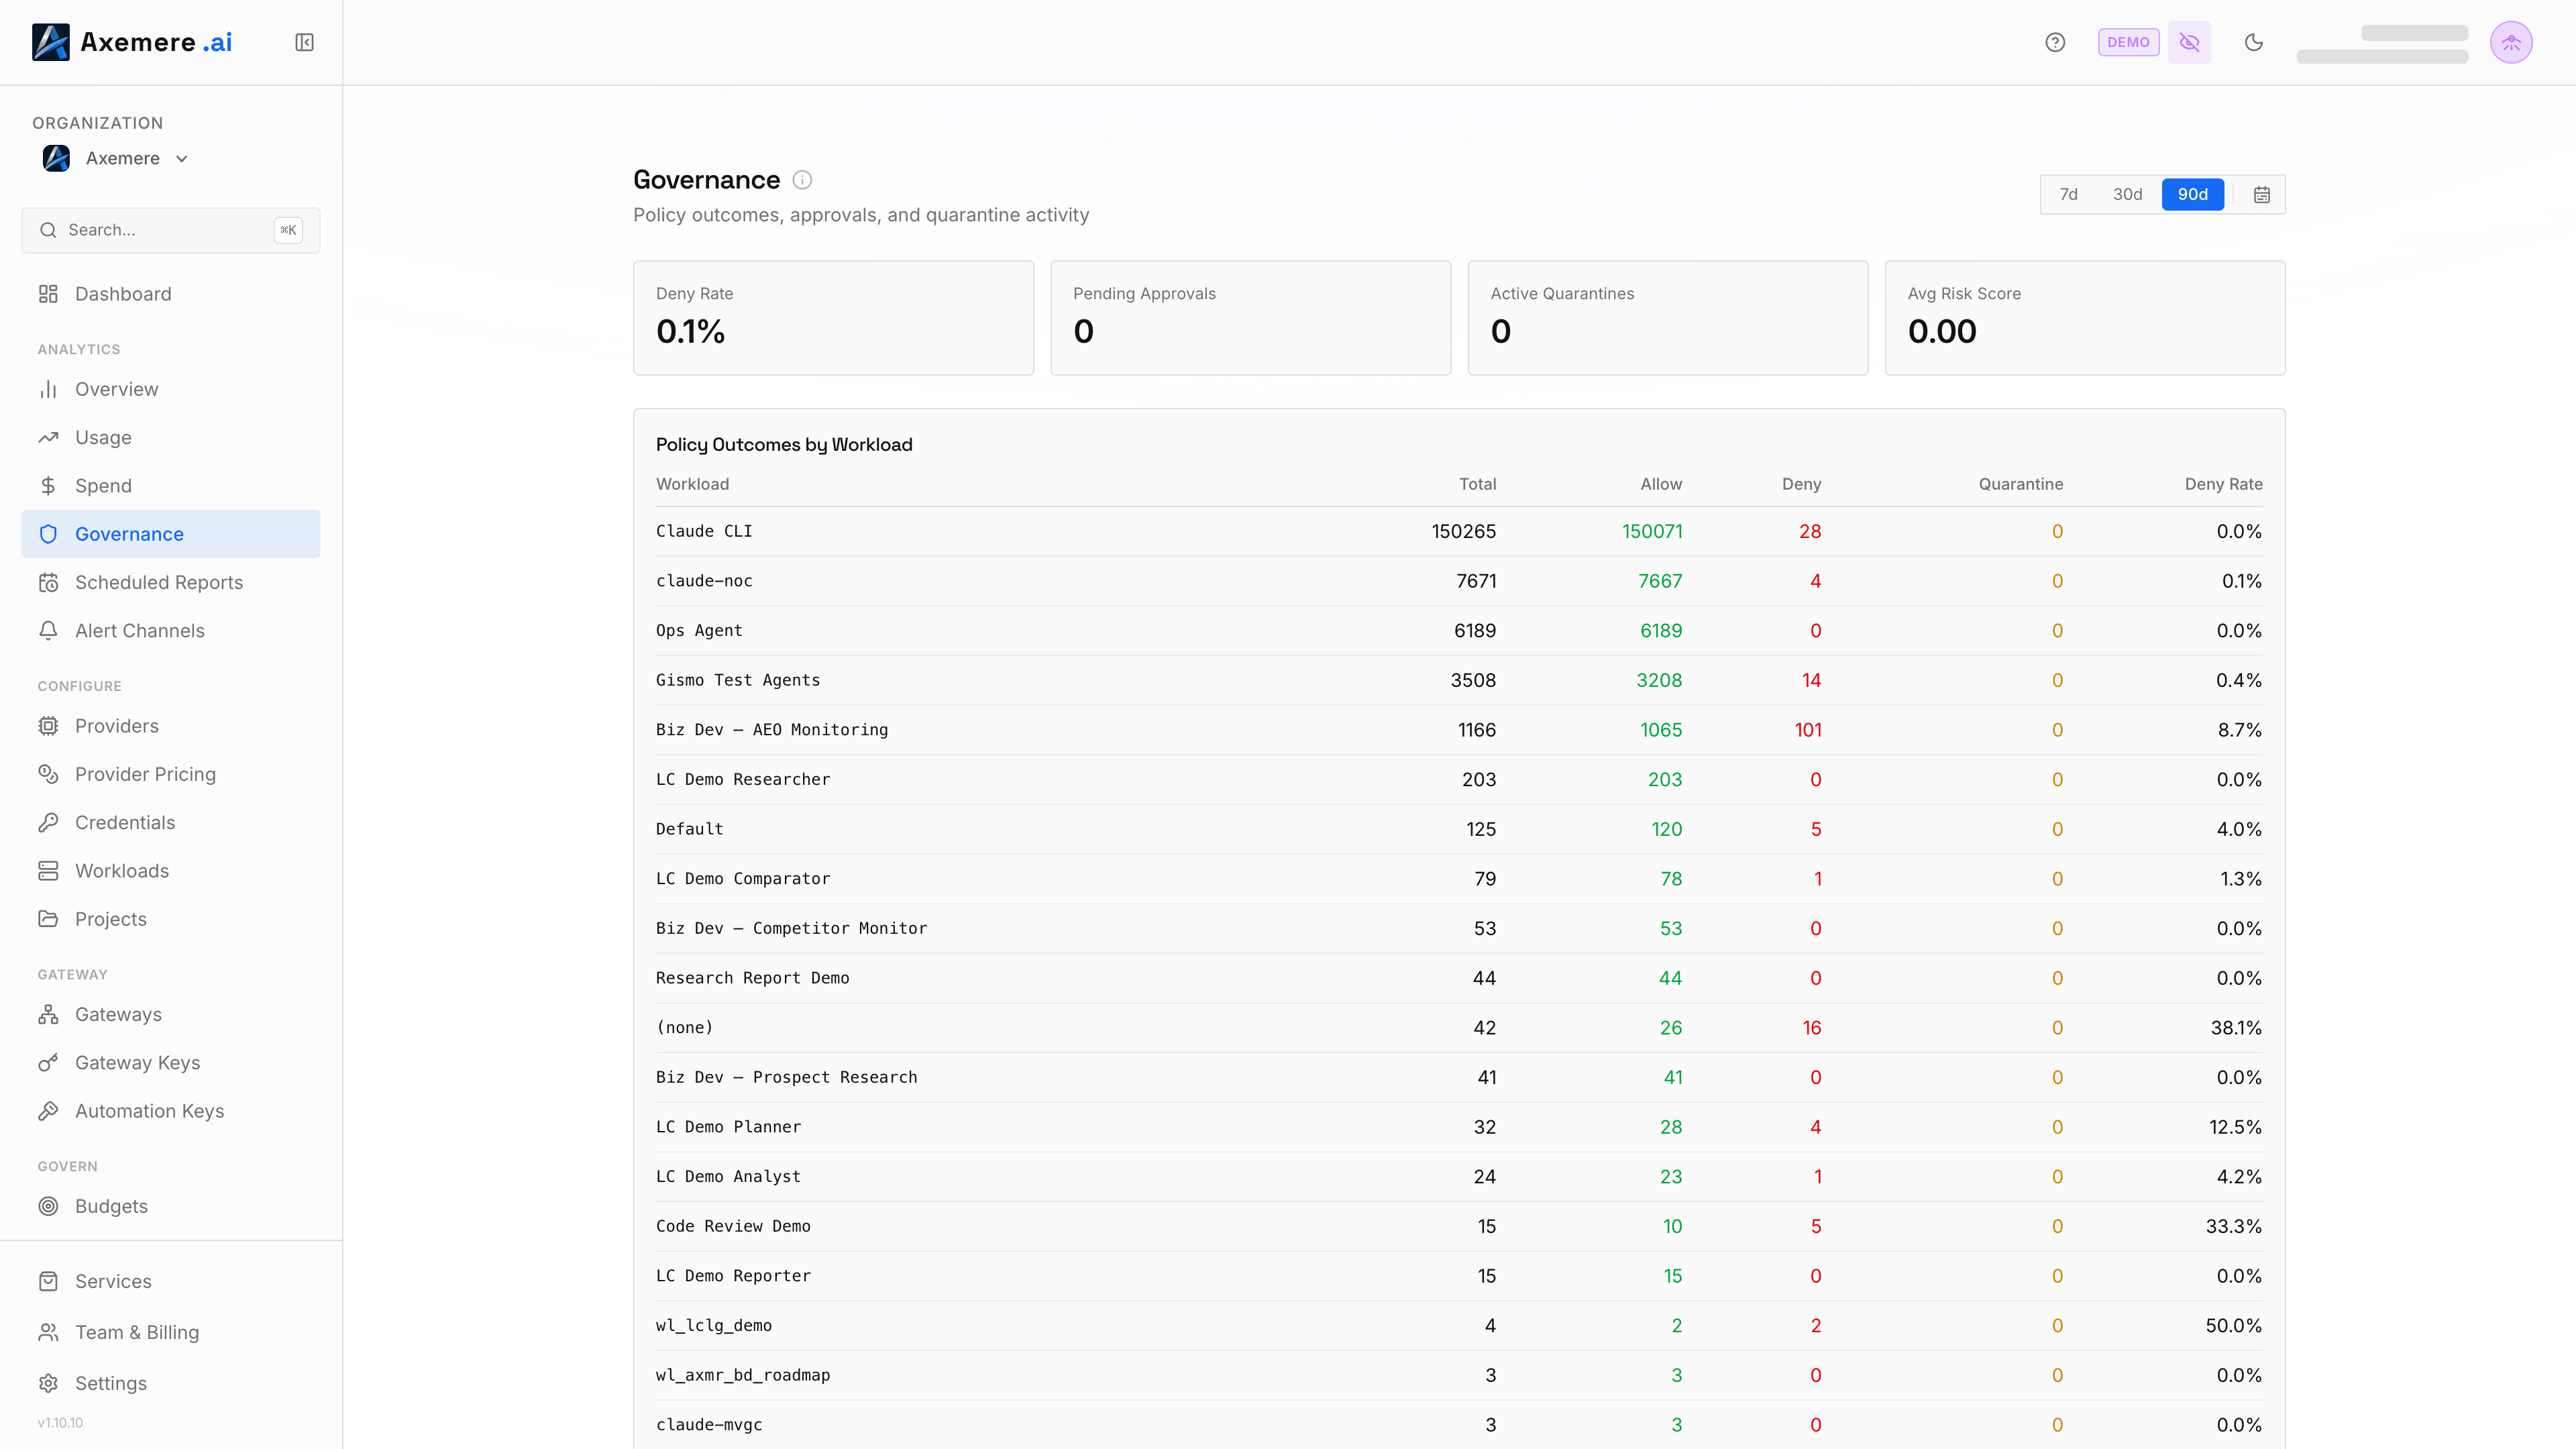
Table of Contents
- Governance Metrics
- Policy Outcomes by Workload
- Denial Reasons
- Action Queues
- Cost Anomaly Detection
- Period Selection
Governance Metrics
Summary cards at the top of the page show governance health for the selected period:
| Metric | Description |
|---|---|
| Deny Rate | Denied requests as a percentage of total requests |
| Pending Approvals | Requests currently in the approval queue awaiting review |
| Active Quarantines | Requests currently held in quarantine |
| Avg Risk Score | Average risk score of currently quarantined items |
Policy Outcomes by Workload
Below the summary cards, a table shows governance metrics broken down by workload (only shown when there's data for the selected period):
| Column | Description |
|---|---|
| Workload | Workload ID (resolved to a name where available) |
| Total | Total decisions for this workload |
| Allow | Allowed request count |
| Deny | Denied request count |
| Quarantine | Quarantined request count |
| Deny Rate | Deny rate for this workload |
This view helps identify specific workloads that are generating elevated denial or quarantine rates, which can indicate misconfigured policies or unexpected usage patterns.
Denial Reasons
Below Policy Outcomes, a simple list (only shown when there's data) shows every distinct denial
reason seen in the selected period and how many times it occurred, sorted most-frequent first. Each
row falls back from the policy-engine's decision_reason to a generic reason when the more
specific field isn't set.
Action Queues
Below Denial Reasons, the Governance page shows live snapshots (up to 10 rows each, click a row or "View all →" to open the full page):
- Pending Approvals — Workload, Action Type, Reason, and Age columns; links to the Approvals page.
- Active Quarantines — Workload, Risk Score, and Age columns; links to the Quarantine page.
Cost Anomaly Detection
Last on the page: Axemere automatically detects workloads with unusual cost patterns over the last 7 days by comparing each workload's recent cost to its rolling baseline. Anomalies appear in a table:
| Column | Description |
|---|---|
| Workload | The workload ID with anomalous cost |
| Current Cost | Cost in the detected anomaly window |
| Baseline Cost | Expected cost based on the rolling baseline |
| Change | Percentage delta from baseline (+ for spike, − for drop) |
| Direction | ↑ Spike (cost significantly higher than normal) or ↓ Drop (cost significantly lower than normal) |
Spikes may indicate runaway usage, a misconfigured workload, or an attack. Drops may indicate a broken integration, an application outage, or a workload that has stopped being used.
When no anomalies are detected, a "No anomalies detected" message is shown.
Period Selection
The governance metrics (denial rate, denial count) use the same period selector as other analytics pages. Anomaly detection always covers the last 7 days regardless of the selected period.
Related: Approval Workflows | Quarantine | Risk Scoring | Analytics Overview | Policies