
Dashboard
For: Platform operators and team leads monitoring real-time gateway activity and spend.
The Dashboard is the home screen of the Axemere console. It shows a live summary of current billing period activity across all gateways in your organization.
Navigation: console.axemere.ai (root path)
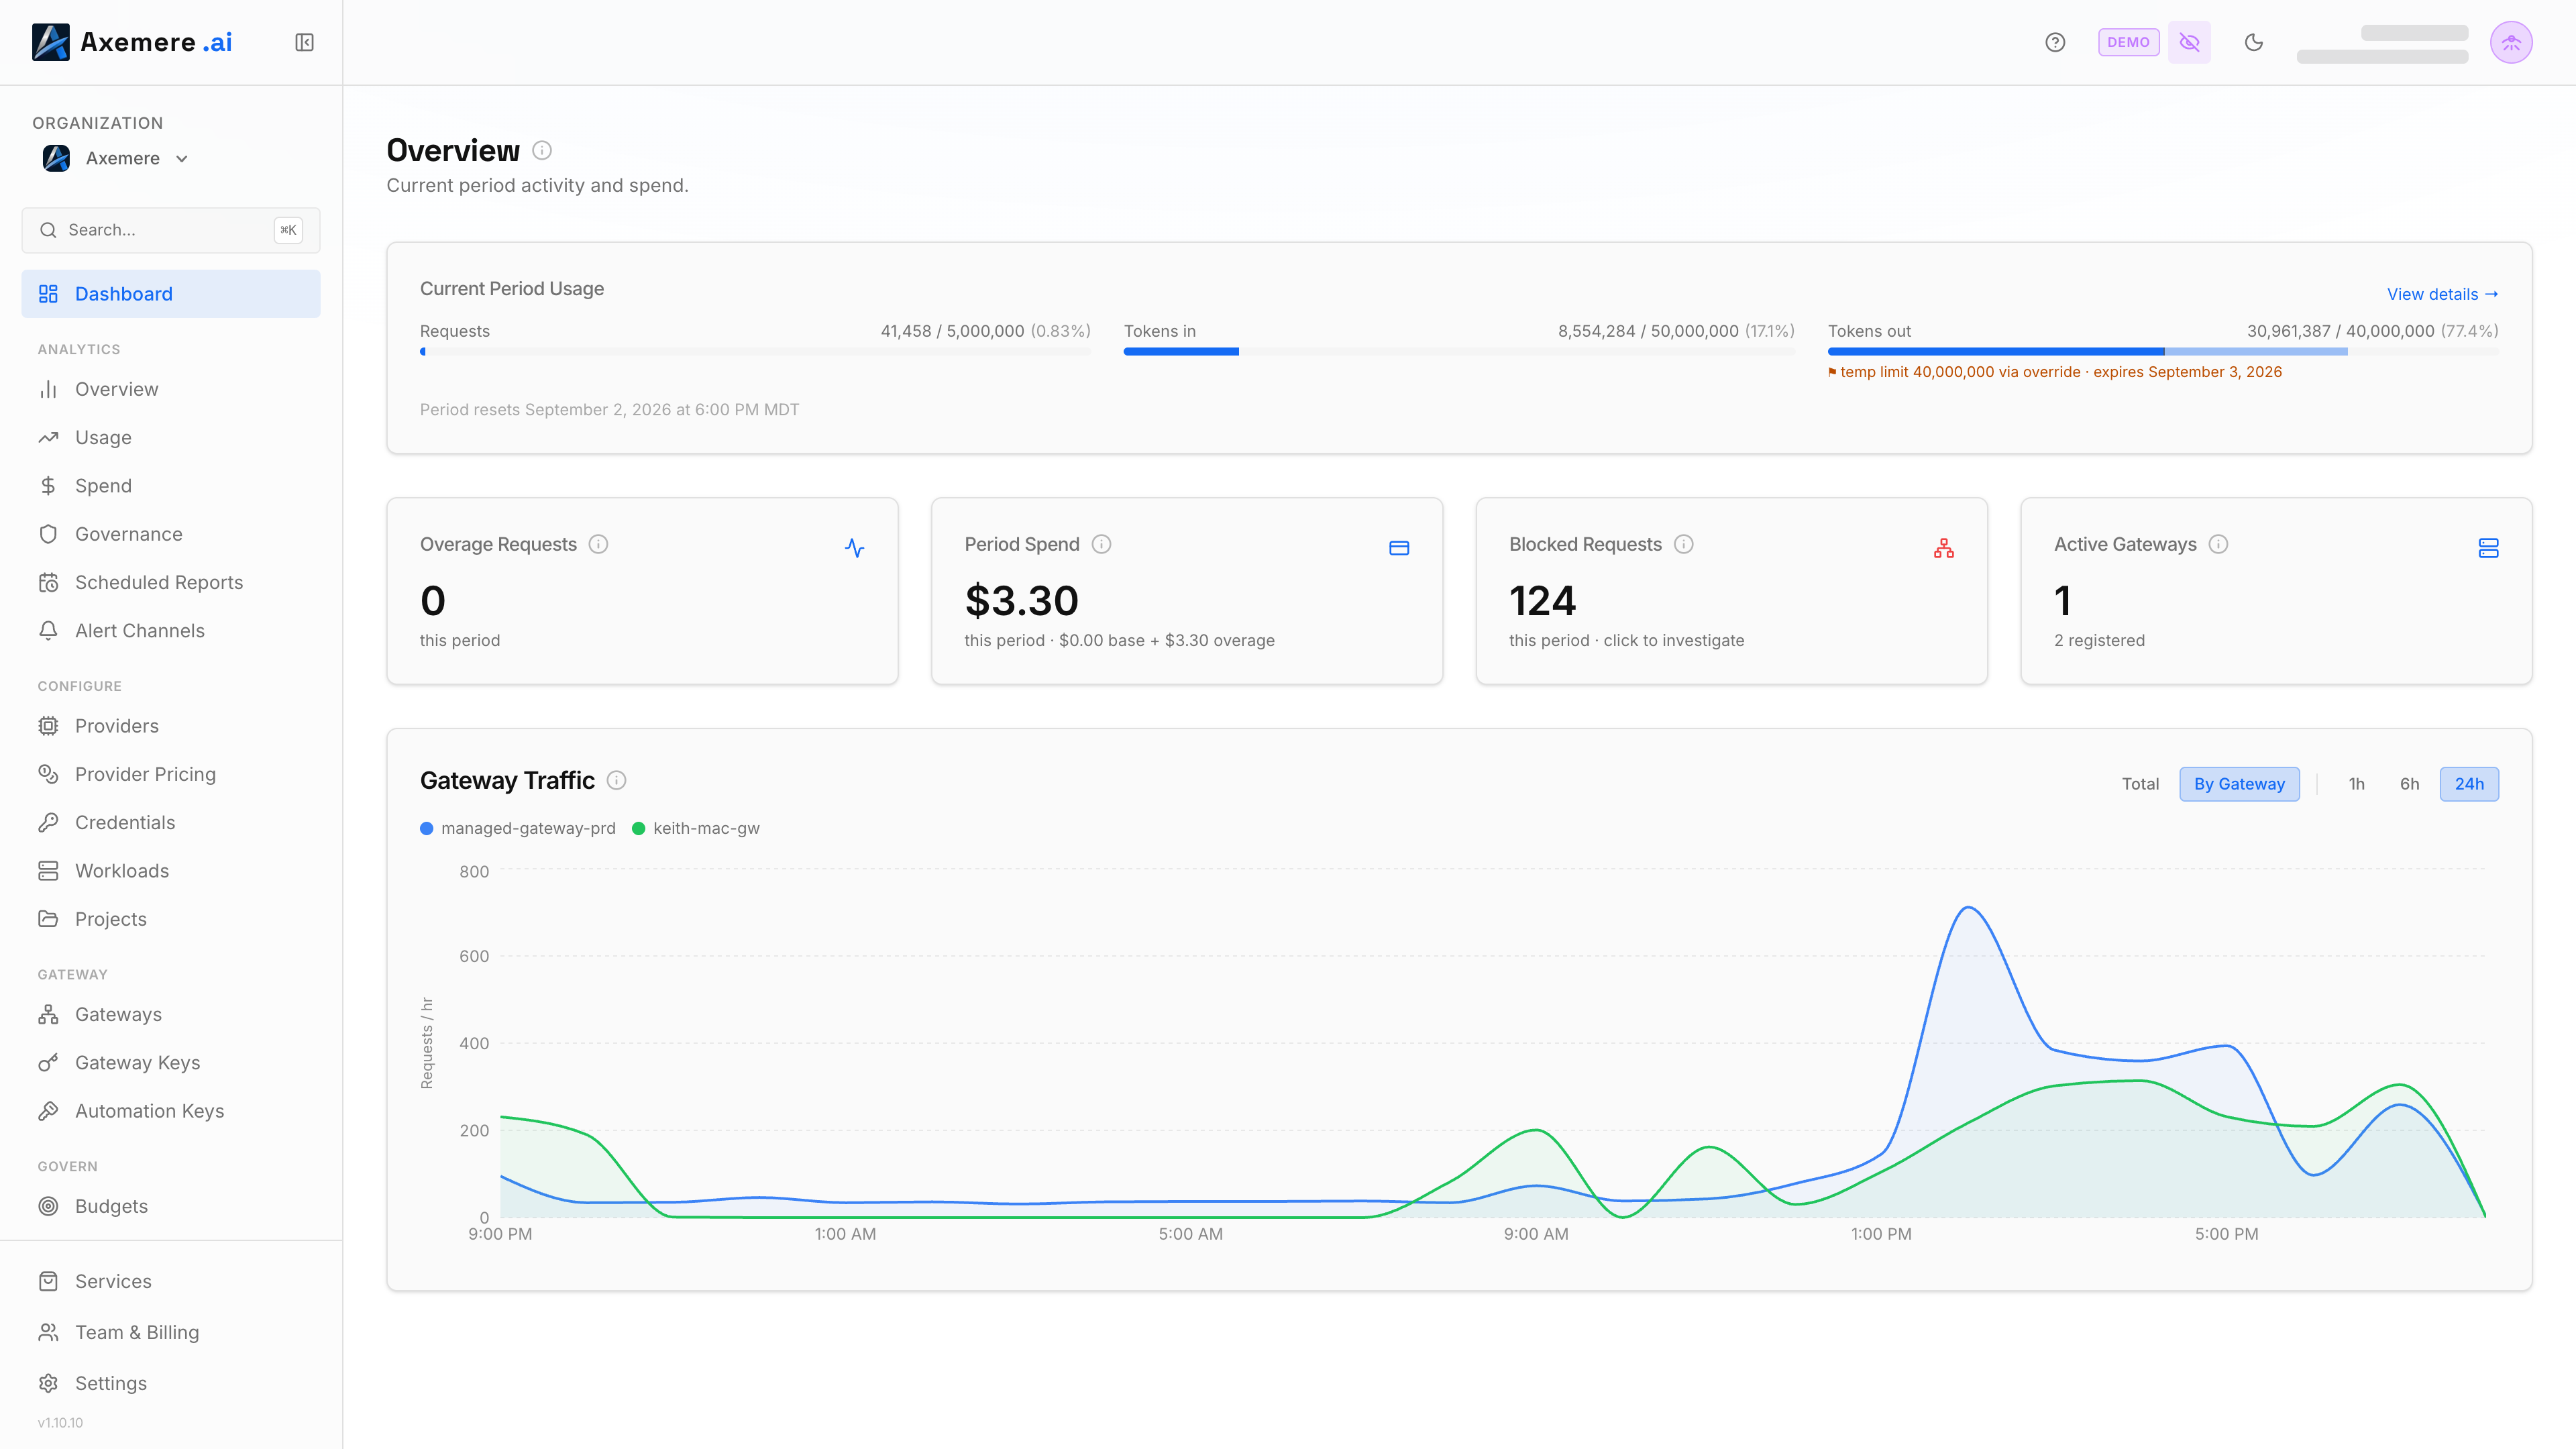
Table of Contents
Current Period Usage
When you have an active managed gateway subscription, a usage panel appears showing your progress against included limits:
| Metric | What It Measures |
|---|---|
| Requests | Total requests routed this billing period vs. included quota |
| Tokens In | Input tokens consumed vs. included quota |
| Tokens Out | Output tokens generated vs. included quota |
Each metric shows a progress bar and percentage utilization. The period reset date is shown below.
Usage warnings appear inline:
- ≥ 80%, overage disabled: Gateway will pause when the limit is reached.
- ≥ 80%, overage enabled: Additional usage billed at $0.50 per 100K requests.
- ≥ 100%, overage disabled: Gateway is paused. Enable overage or upgrade to resume.
- ≥ 100%, overage enabled: Overage charges are accruing; estimated charge is shown.
Metric Cards
Four summary cards are shown below the usage panel:
| Card | Description |
|---|---|
| Overage Requests | Requests beyond the included quota this period |
| Period Spend | Subscription base price plus overage charges accrued so far |
| Blocked Requests | Requests denied by policy or gateway rules this period; click to open Records filtered to denied requests |
| Active Nodes | Gateway nodes that have sent a heartbeat in the last 24 hours; shows total registered count |
Gateway Traffic Chart
A time-series area chart shows request volume over a selectable window.
Time windows:
| Window | Granularity |
|---|---|
| 1h | Per-minute buckets |
| 6h | ~10-minute buckets |
| 24h | Hourly buckets (default) |
View modes:
| Mode | What It Shows |
|---|---|
| Total | Aggregate requests across all nodes, with blocked requests overlaid in red |
| By Node | Per-gateway node breakdown, useful for multi-node deployments |
In By Node mode, a color legend identifies each node. Your window and view mode preferences are saved automatically.
New User Behavior
On first login, the dashboard redirects to the Get Started page until you dismiss it or complete all setup steps. Once dismissed:
- The dashboard shows a prompt card ("No requests yet") if no traffic has flowed yet.
- The prompt disappears permanently once the first request appears.
Related: Records | Analytics Overview | Usage | Services