
Analytics Overview
For: Platform operators and team leads monitoring overall gateway activity and cost trends.
Operations Overview | Records | Usage | Analytics Overview | Analytics → Spend | Analytics → Governance | Govern → Budgets | Scheduled Reports
The Analytics Overview page shows a high-level summary of AI gateway activity for a selected time period: total spend, request volume, allow/deny rates, token consumption, and an activity trend chart.
Navigation: console.axemere.ai/analytics
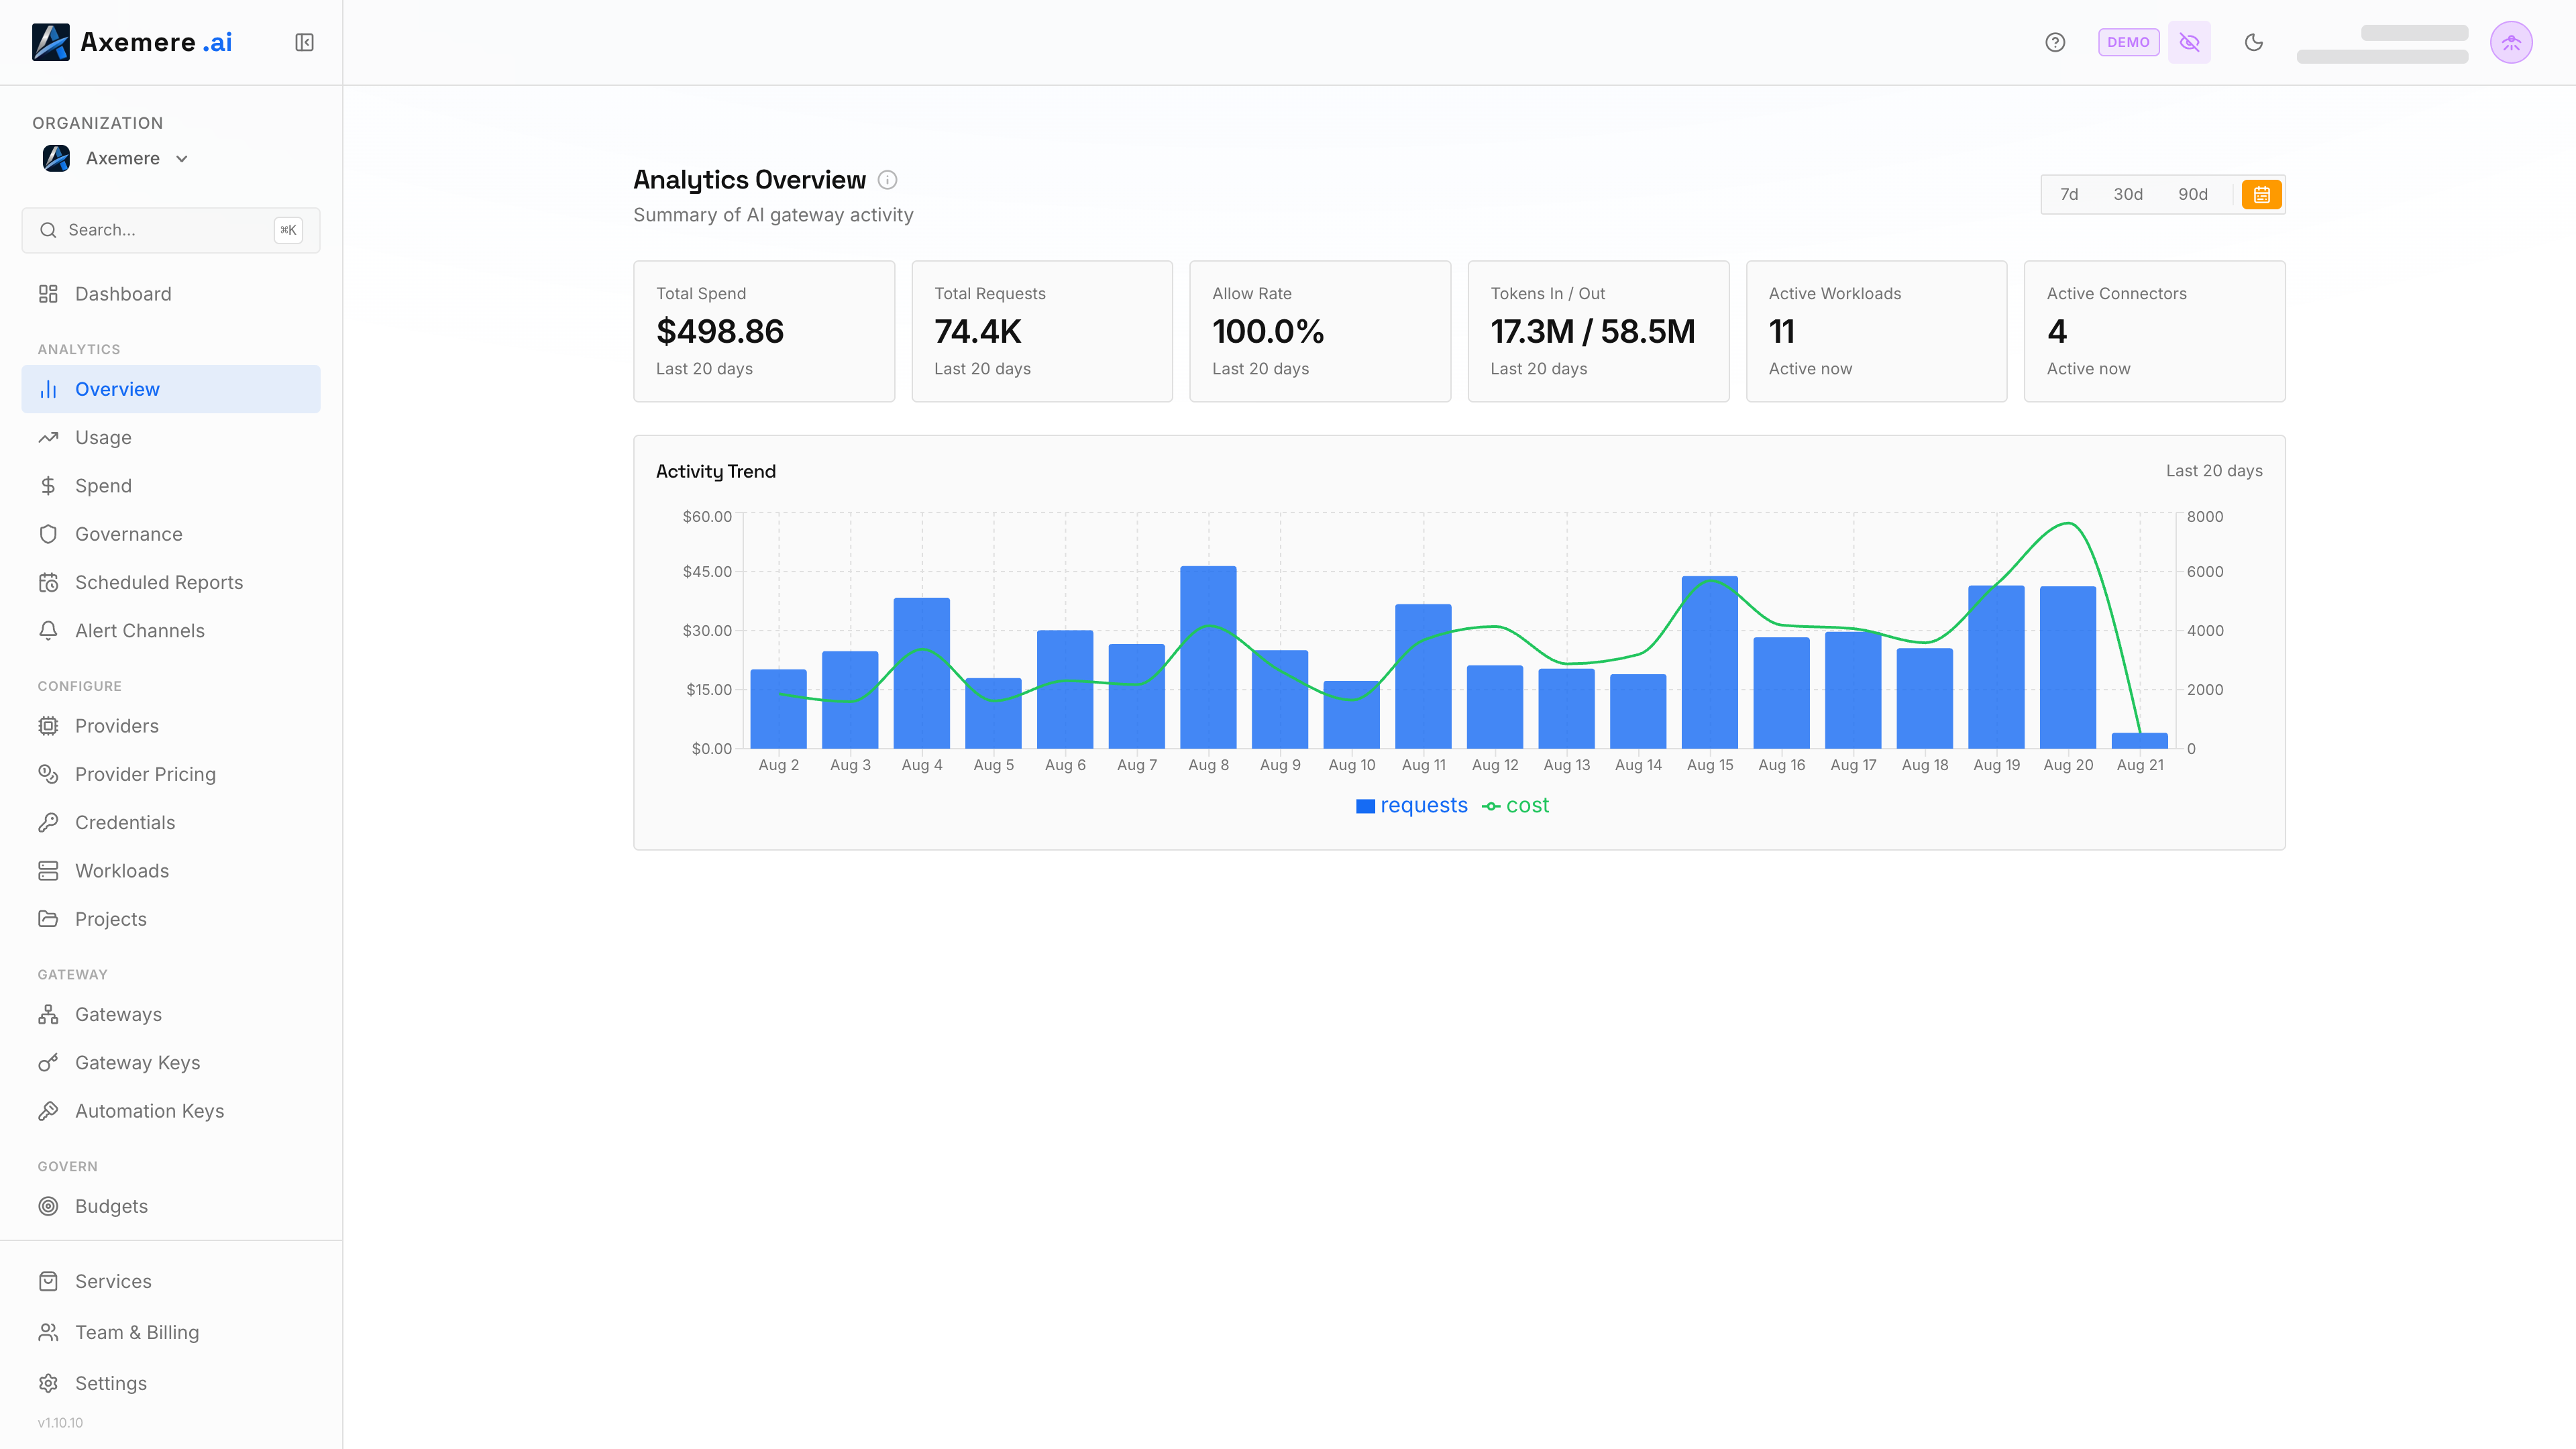
Table of Contents
Summary Cards
Six metric cards summarize activity for the selected period:
| Card | Description |
|---|---|
| Total Spend | Aggregate cost_usd for all requests in the period |
| Total Requests | Number of requests routed through the gateway |
| Allow Rate | Percentage of requests allowed vs. total (allowed + denied) |
| Tokens In / Out | Combined input tokens and output tokens |
| Active Workloads | Number of distinct workloads that had at least one request |
| Active Connectors | Number of distinct connectors (provider endpoints) in use |
Cards update when you change the period selector.
Activity Trend Chart
The trend chart plots daily request volume and cost over the selected period using a dual-axis composed chart:
| Series | Axis | Chart Type |
|---|---|---|
| Requests | Right Y-axis | Bars |
| Cost (USD) | Left Y-axis | Line |
Hover a data point to see the exact values for that day. The dual-axis layout lets you compare request volume and cost trends on the same timeline, useful for spotting days where cost moved disproportionately to volume (indicating model mix shifts or anomalous usage).
Period Selection
Use the period selector in the top-right to change the time window:
| Option | Description |
|---|---|
| Last 7 days | Rolling 7-day window |
| Last 30 days | Rolling 30-day window (default) |
| Last 90 days | Rolling 90-day window |
| Billing period | Current billing period start to now |
Your period selection is persisted across sessions.
Related: Analytics → Spend | Analytics → Governance | Govern → Budgets | Usage | Dashboard