
Usage
For: Platform operators and finance teams analyzing request volume and token consumption over time.
Operations Overview | Records | Usage | Analytics Overview | Analytics → Spend
The Usage page provides time-series charts and breakdowns of request counts, token consumption, and cost, with flexible period selection and dimension filtering.
Navigation: console.axemere.ai/usage
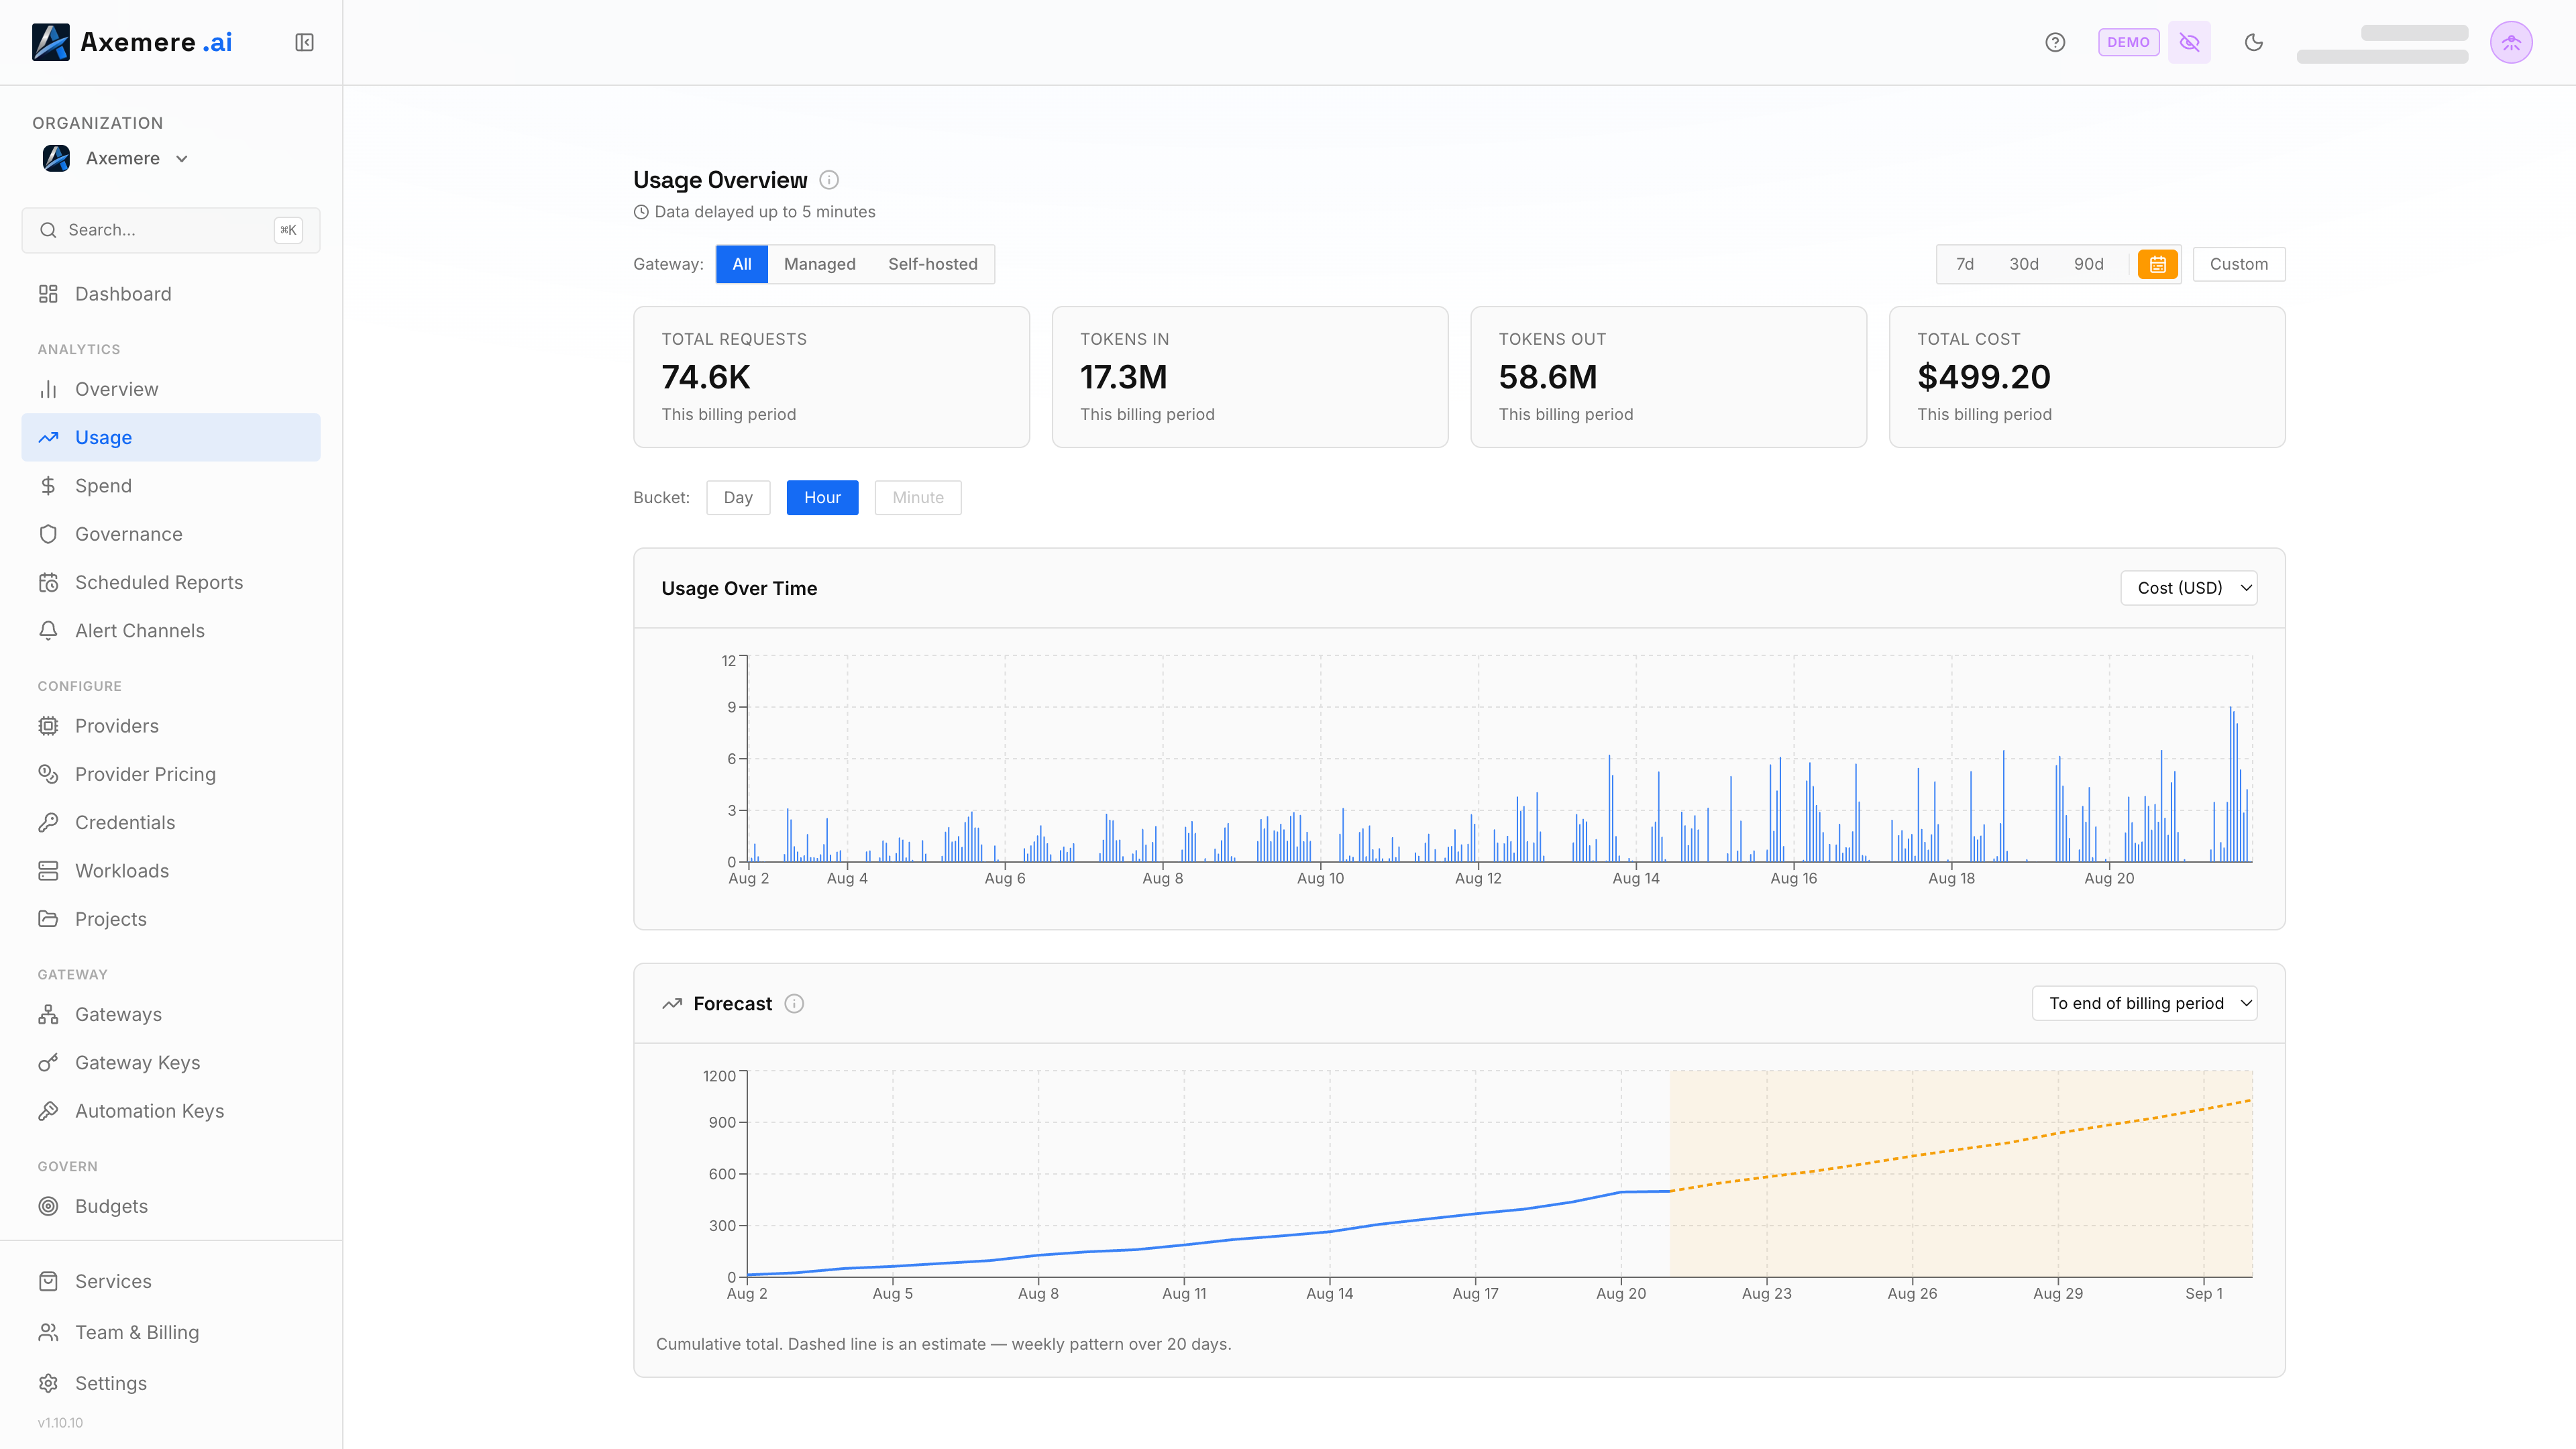
Table of Contents
Time-Series Overview
The top section shows aggregate metrics for the selected period:
| Metric | Description |
|---|---|
| Total Requests | Number of requests routed through the gateway |
| Total Tokens | Combined input + output tokens |
| Total Cost | Computed cost_usd for the period |
Below the summary, a bar chart shows requests (or your selected metric) bucketed by time. Bucket size adjusts automatically based on the selected period: hours for short windows, days for longer ones.
Metric selector: Use the dropdown to switch the chart between:
- Requests
- Tokens In
- Tokens Out
- Cost (USD)
Period Selection
Choose a time window using the period selector:
| Option | Description |
|---|---|
| Last 7 days | Rolling 7-day window |
| Last 30 days | Rolling 30-day window |
| Last 90 days | Rolling 90-day window |
| Billing period | Current billing period (requires active managed gateway subscription) |
| Custom | Enter a specific start and end date/time |
Your period selection is saved across sessions.
Breakdown by Dimension
Below the time-series chart, a breakdown table shows usage split by a selected dimension. Use the dimension dropdown to switch between:
| Option | Groups by |
|---|---|
| Model | Model name (e.g., gpt-4o, claude-3-5-sonnet) |
| Connector | Provider connector hostname |
| Workload | Workload ID |
| Project | Project ID |
| Node | Gateway node ID |
| Account | Account attribution tag |
| Customer | Customer attribution tag |
Each row shows: dimension value, request count, tokens in, tokens out, cost, and percentage of total. Rows are sortable by any column.
Gateway Type Filter
When your organization has both managed and self-hosted gateways, use the Gateway Type filter in the overview section to isolate traffic:
| Filter | Shows |
|---|---|
| All | Combined traffic |
| Managed | Axemere-hosted gateway traffic only |
| Self-Hosted | Your own deployed gateway traffic only |
Related: Records | Analytics Overview | Analytics → Spend | Dashboard