
Analytics — Governance
For: Security teams and platform operators monitoring policy enforcement, anomalies, and review queues.
Operations Overview | Analytics Overview | Analytics → Spend | Analytics → Governance | Govern → Budgets | Scheduled Reports
The Governance page provides a security-focused view of gateway activity: denial rates, pending approvals, quarantined requests, and automated cost anomaly detection.
Navigation: console.axemere.ai/analytics/governance
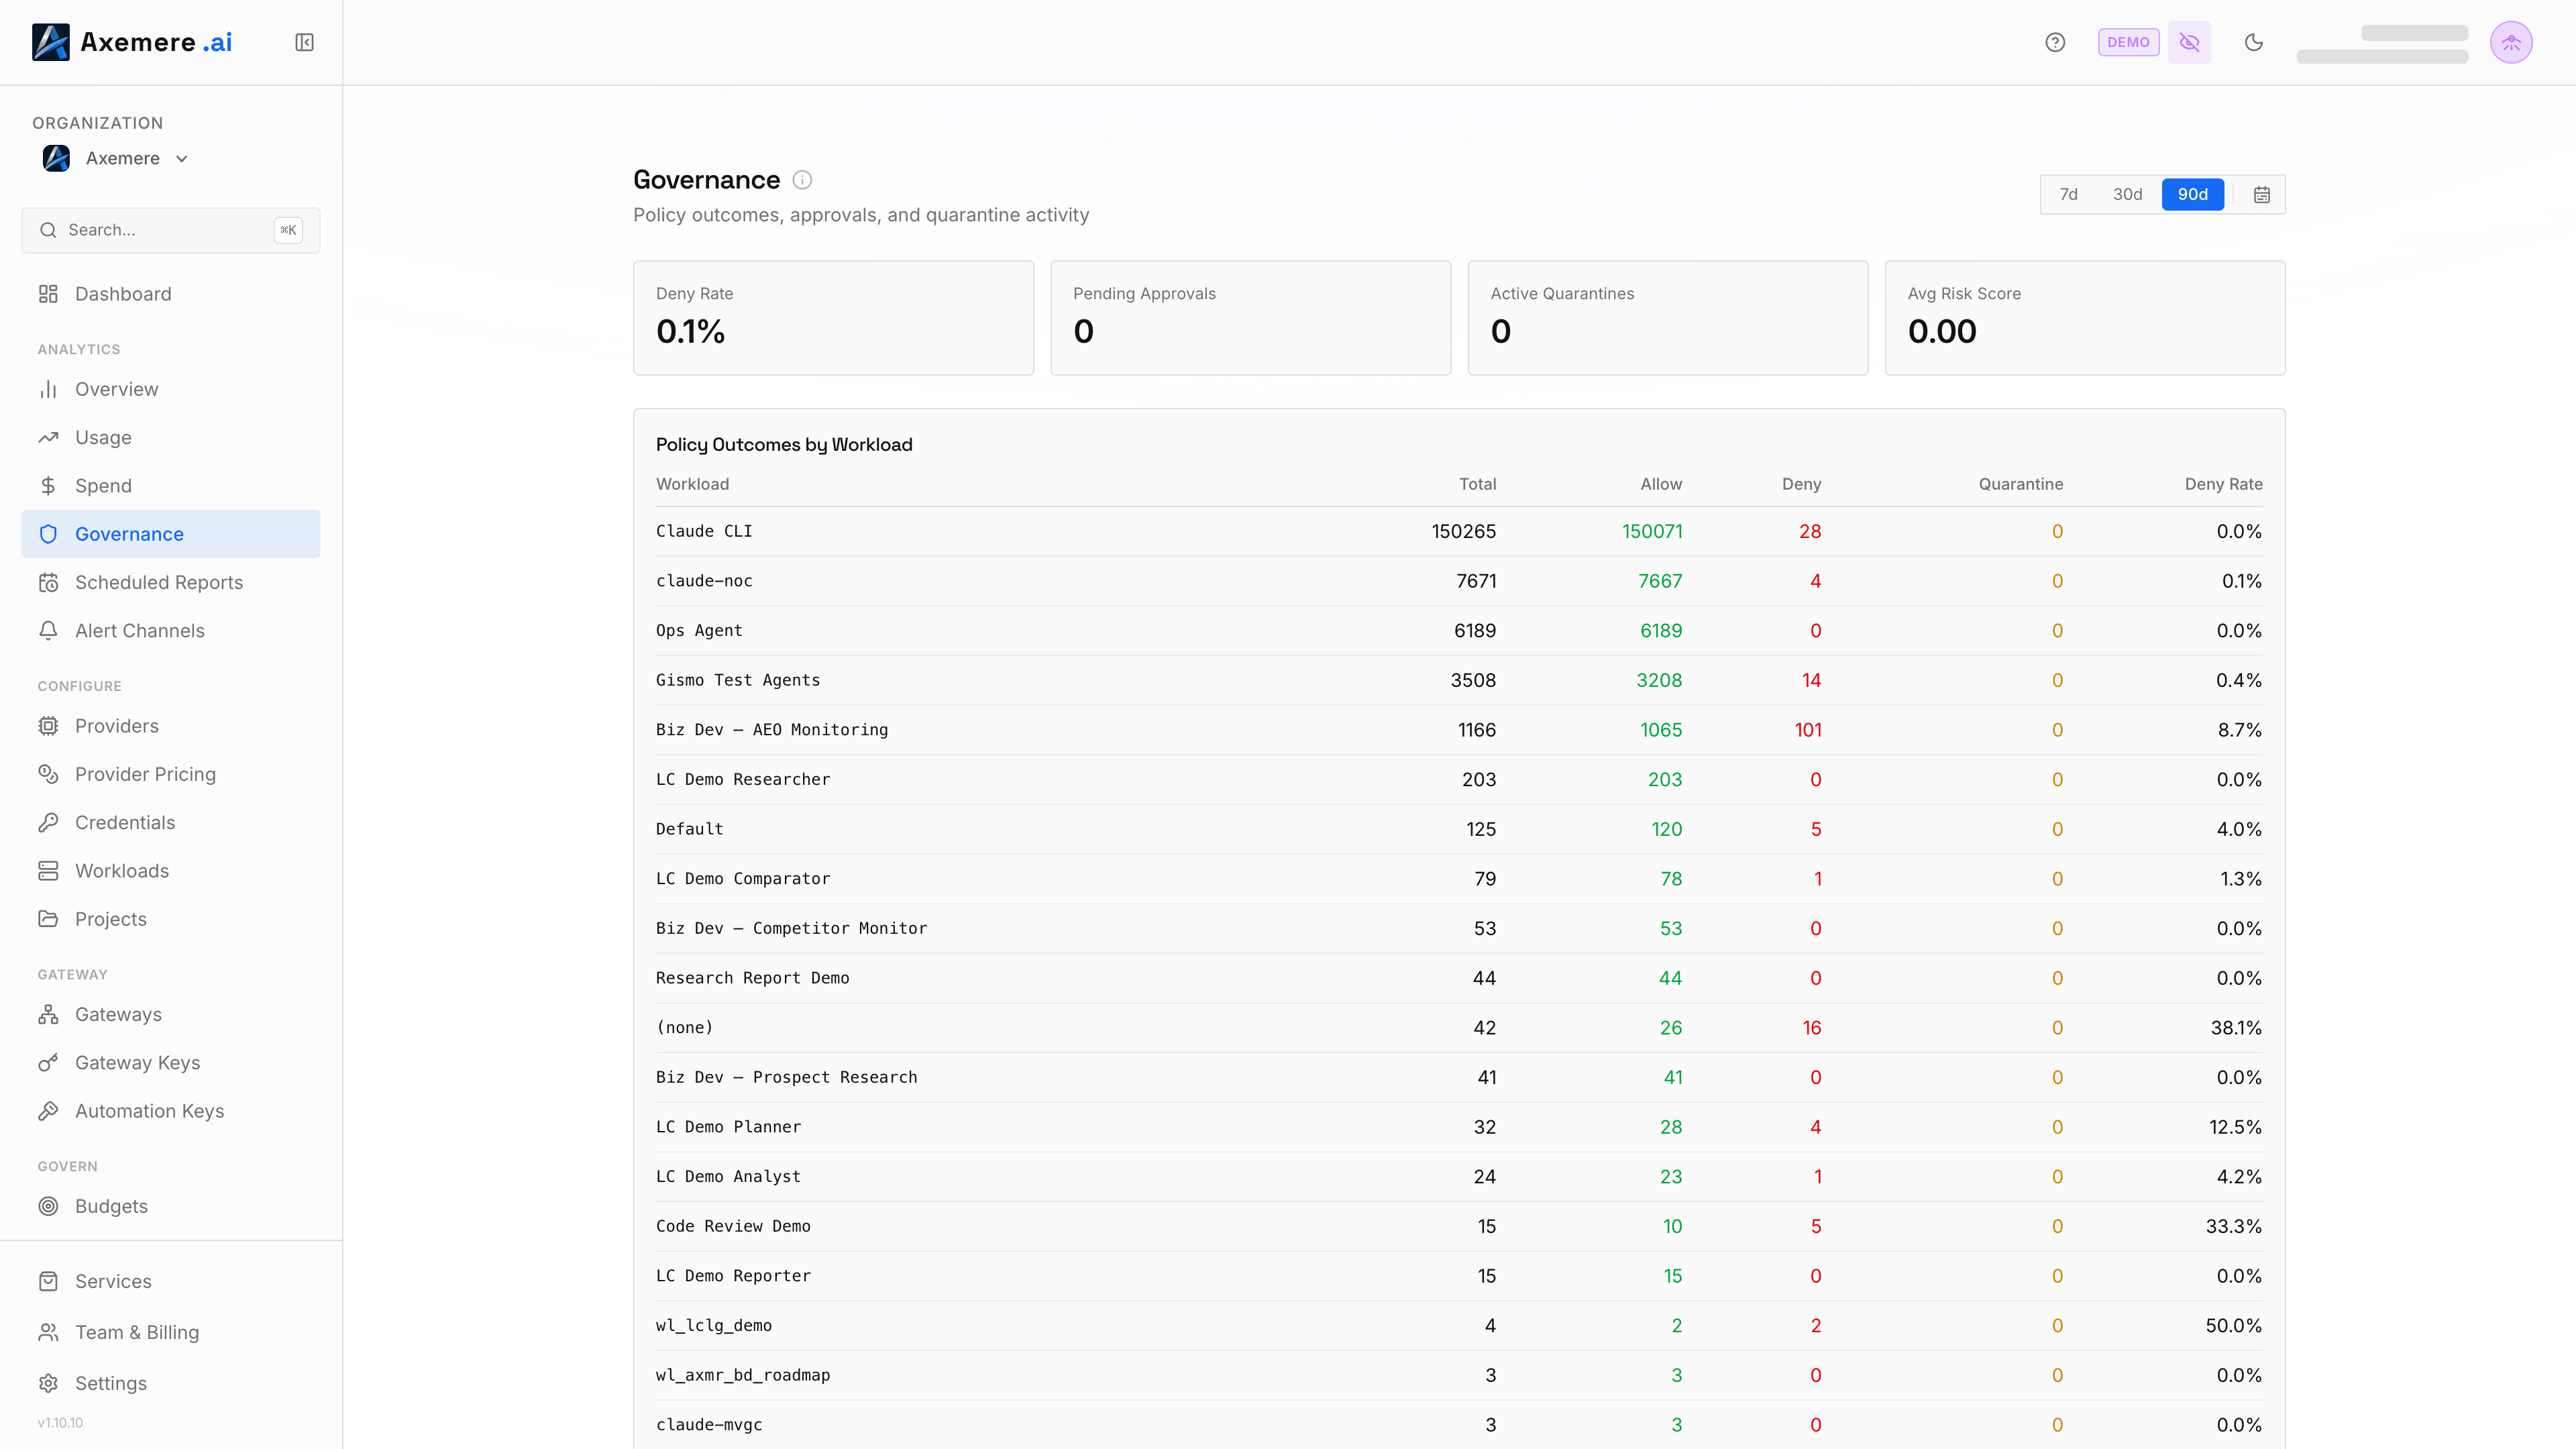
Table of Contents
Governance Metrics
Summary cards at the top of the page show governance health for the selected period:
| Metric | Description |
|---|---|
| Deny Rate | Denied requests as a percentage of total requests |
| Pending Approvals | Requests currently in the approval queue awaiting review |
| Active Quarantines | Requests currently held in quarantine |
| Avg Risk Score | Average risk score of currently quarantined items |
Cost Anomaly Detection
Axemere automatically detects workloads with unusual cost patterns over the last 7 days by comparing each workload's recent cost to its rolling baseline. Anomalies appear in a table:
| Column | Description |
|---|---|
| Workload | The workload ID with anomalous cost |
| Current Cost | Cost in the detected anomaly window |
| Baseline Cost | Expected cost based on the rolling baseline |
| Change | Percentage delta from baseline (+ for spike, − for drop) |
| Direction | ↑ Spike (cost significantly higher than normal) or ↓ Drop (cost significantly lower than normal) |
Spikes may indicate runaway usage, a misconfigured workload, or an attack. Drops may indicate a broken integration, an application outage, or a workload that has stopped being used.
When no anomalies are detected, a "No anomalies" message is shown.
Per-Workload Breakdown
Below the summary cards, a table shows governance metrics broken down by workload:
| Column | Description |
|---|---|
| Workload | Workload ID |
| Allow | Allowed request count |
| Deny | Denied request count |
| Quarantine | Quarantined request count |
| Deny Rate | Deny rate for this workload |
This view helps identify specific workloads that are generating elevated denial or quarantine rates, which can indicate misconfigured policies or unexpected usage patterns.
Action Queues
Below the workload table, the Governance page shows live snapshots of:
- Pending Approvals — requests currently awaiting human review, with links to the Approvals page
- Active Quarantines — requests currently held in quarantine, with a link to the Quarantine page
Period Selection
The governance metrics (denial rate, denial count) use the same period selector as other analytics pages. Anomaly detection always covers the last 7 days regardless of the selected period.
Related: Approval Workflows | Quarantine | Risk Scoring | Analytics Overview | Policies