
Scheduled Reports
For: Platform operators and finance teams automating periodic AI usage reporting.
Operations Overview | Analytics Overview | Analytics → Spend | Govern → Budgets | Scheduled Reports
Scheduled Reports automate the delivery of analytics summaries to email on a recurring basis. You define the report type, cadence, time window, and output format; Axemere generates and delivers the report automatically.
Navigation: console.axemere.ai/analytics/reports
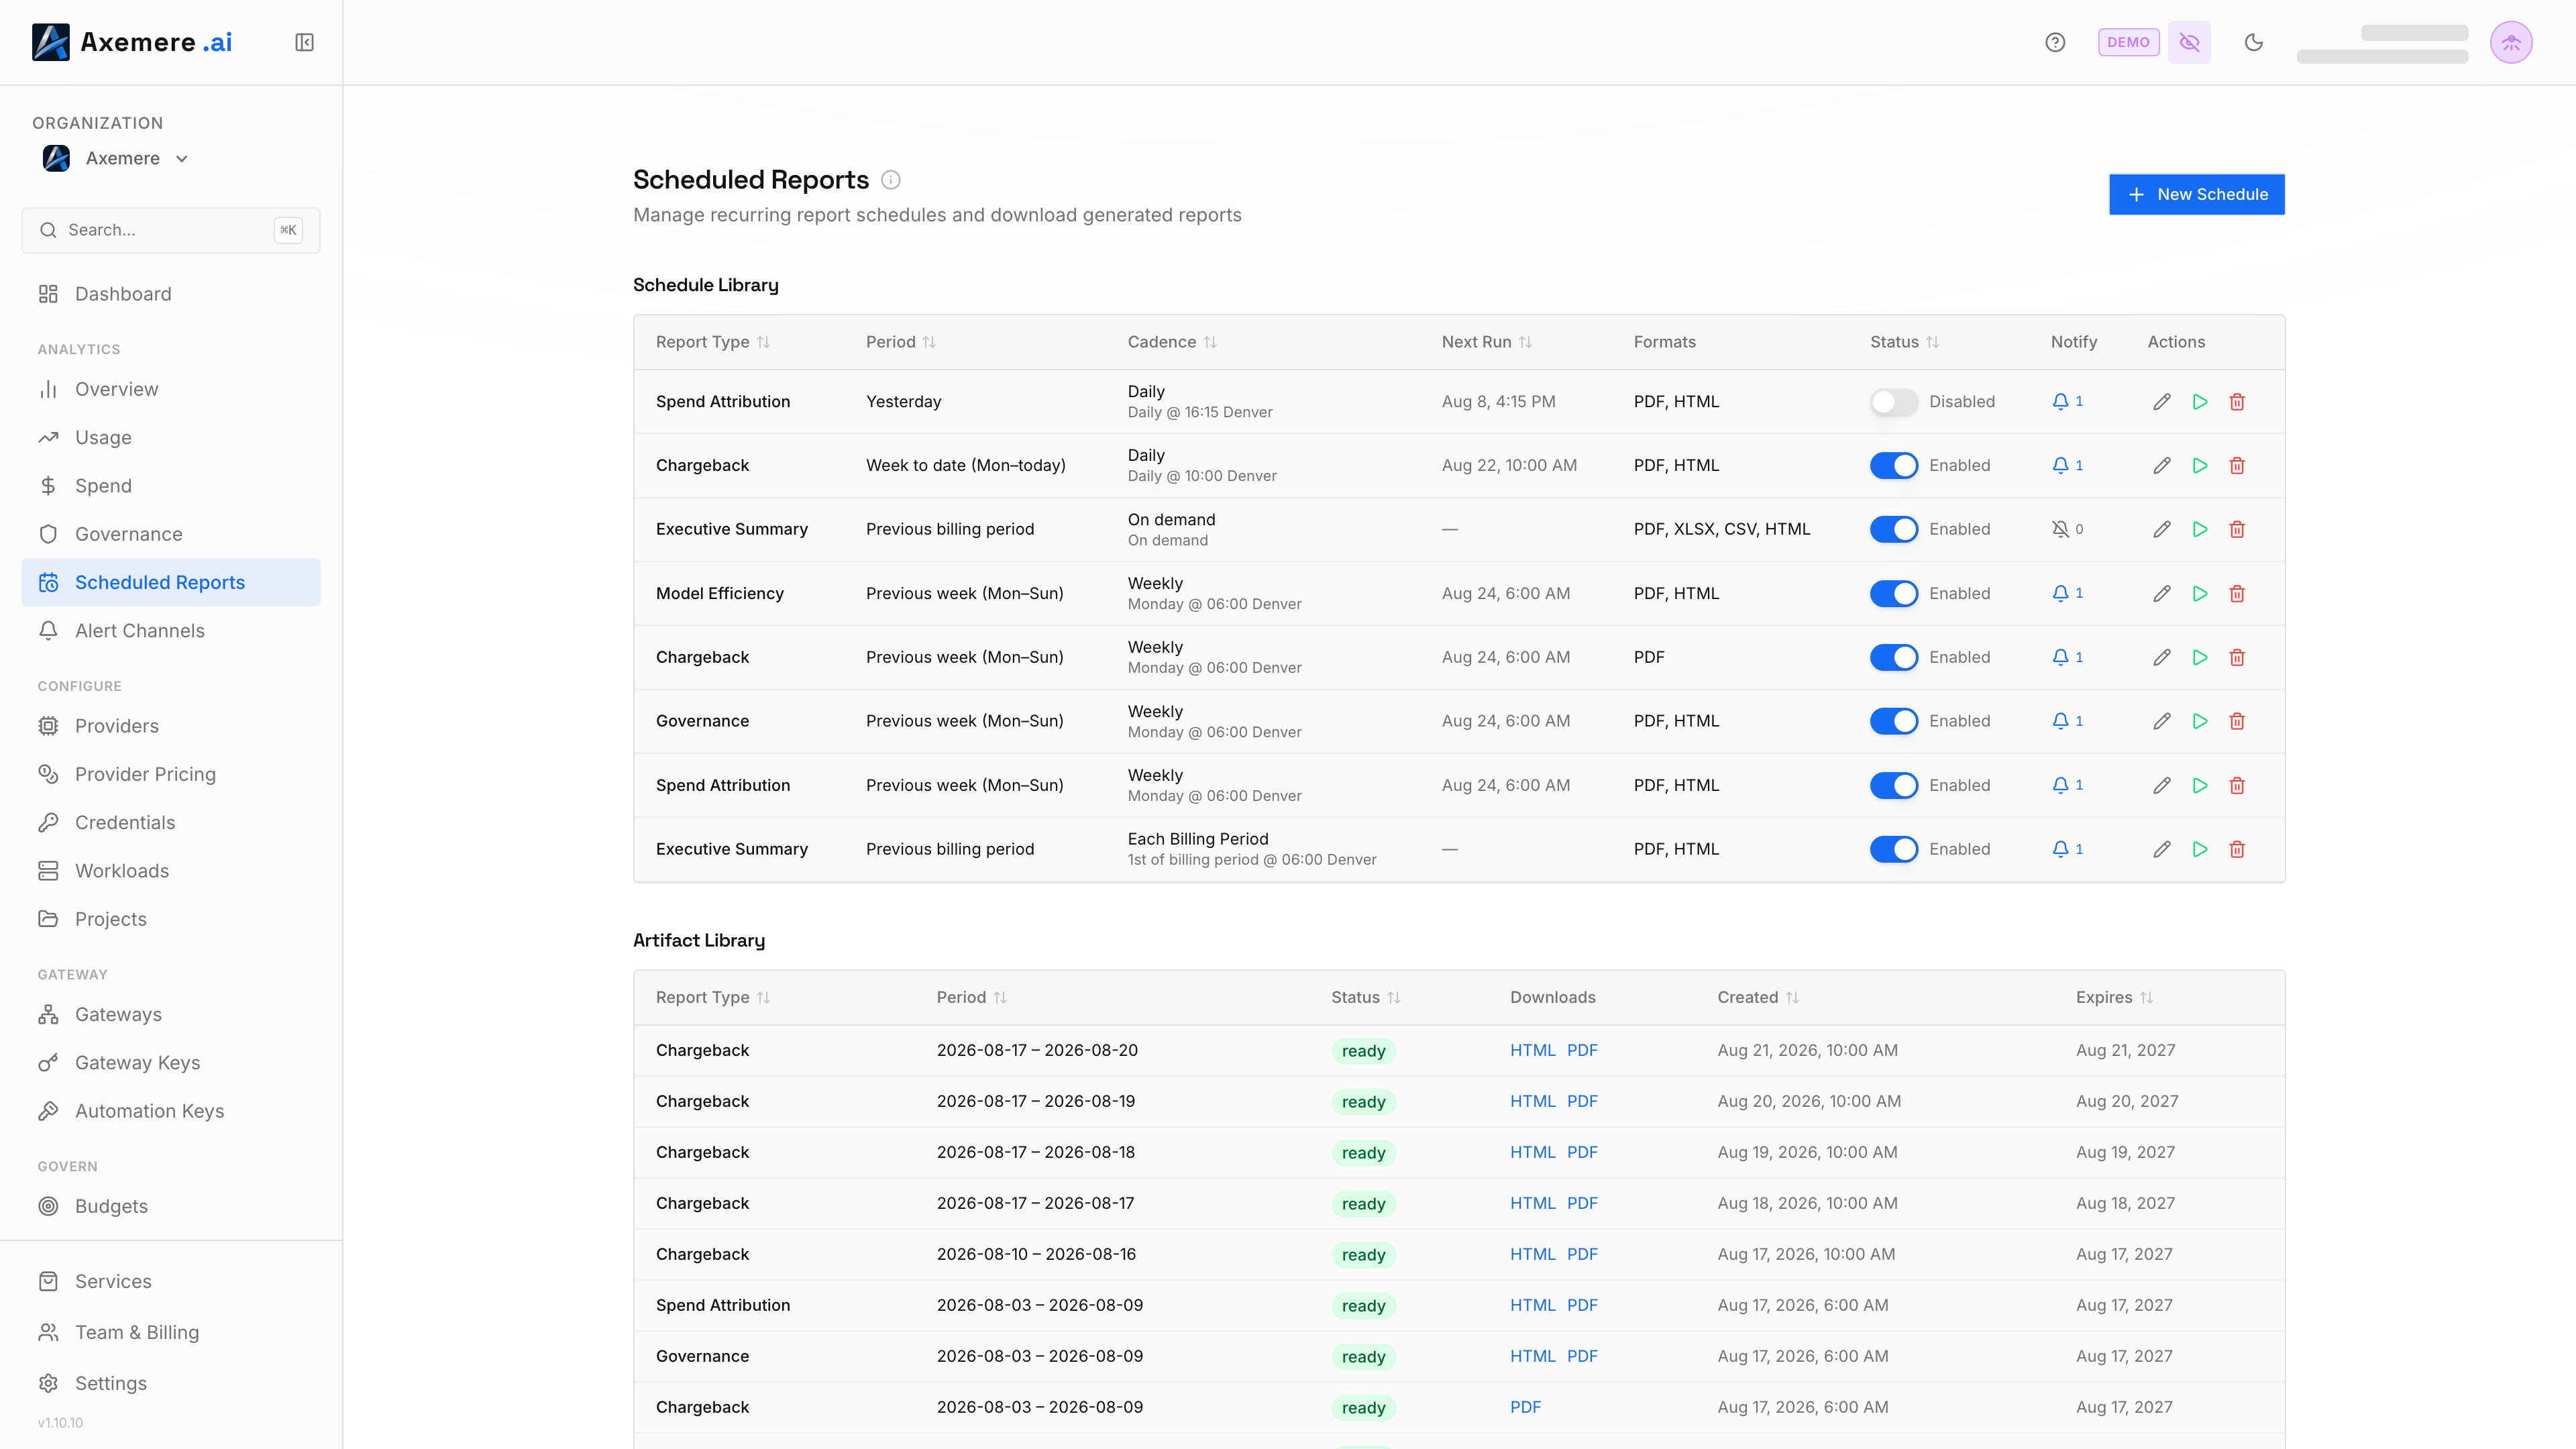
Table of Contents
- Report Types
- Cadences
- Time Windows
- Output Formats
- Creating a Schedule
- Managing Schedules
- Report Artifacts
Report Types
| Type | Contents |
|---|---|
| Executive Summary | High-level overview: total spend, request volume, allow rate, top workloads |
| Spend Attribution | Spend broken down by provider, workload, project, and account |
| Governance | Denial rates, anomaly summary, pending approvals, quarantine status |
| Chargeback | Per-project and per-customer cost breakdown formatted for internal billing |
| Model Efficiency | Token efficiency and cost-per-request by model and workload |
Cadences
| Cadence | Fires |
|---|---|
| Daily | Once per day at the configured time |
| Weekly | Once per week on a configured day of the week |
| Monthly | Once per month on the first day of the month |
| Each Billing Period | Once per billing period, when the period closes |
| On Demand | No automatic schedule — trigger manually |
Time Windows
The time window determines which data is included in the report. Available windows vary by cadence:
| Cadence | Available Windows |
|---|---|
| Daily | Yesterday, Month to date, Week to date, Billing period to date, Last N days |
| Weekly | Previous week, Previous month, Month to date, Billing period to date, Last N days |
| Monthly | Previous month, Last N days |
| Billing Period | Previous billing period |
| On Demand | All windows |
Output Formats
Reports can be delivered in:
| Format | Best For |
|---|---|
| Executive distribution, archiving | |
| XLSX | Finance teams, pivot tables |
| CSV | Data pipelines, custom processing |
| HTML | Email-friendly inline reports |
Creating a Schedule
- Click New Schedule.
- Select a report type.
- Select a cadence.
- Choose a time window (options change based on cadence).
- For daily/weekly cadences, set the delivery time and timezone.
- For weekly cadences, select the day of week.
- For "Last N days" windows, enter the number of days.
- Select one or more output formats.
- Enter one or more recipient email addresses.
- Click Save.
The schedule becomes active immediately. The next fire time is shown on the schedule card.
Managing Schedules
Each schedule card shows:
- Report type, cadence, time window
- Next scheduled fire time
- Recipient list
- Output format
Actions:
- Edit (pencil icon) — modify any schedule parameter
- Run Now (play icon) — trigger an on-demand generation immediately
- Delete (trash icon) — remove the schedule permanently
Report Artifacts
Below the schedule list, Recent Reports shows a history of generated report files:
| Field | Description |
|---|---|
| Report Type | The type of report generated |
| Period | The data window the report covers |
| Generated | When the report was generated |
| Status | completed, failed, or pending |
| Actions | Download or retry (for failed artifacts) |
Click Download to retrieve a completed report. Click Retry to re-trigger generation of a failed report.
Related: Analytics Overview | Analytics → Spend | Govern → Budgets | Export Destinations