
Spend
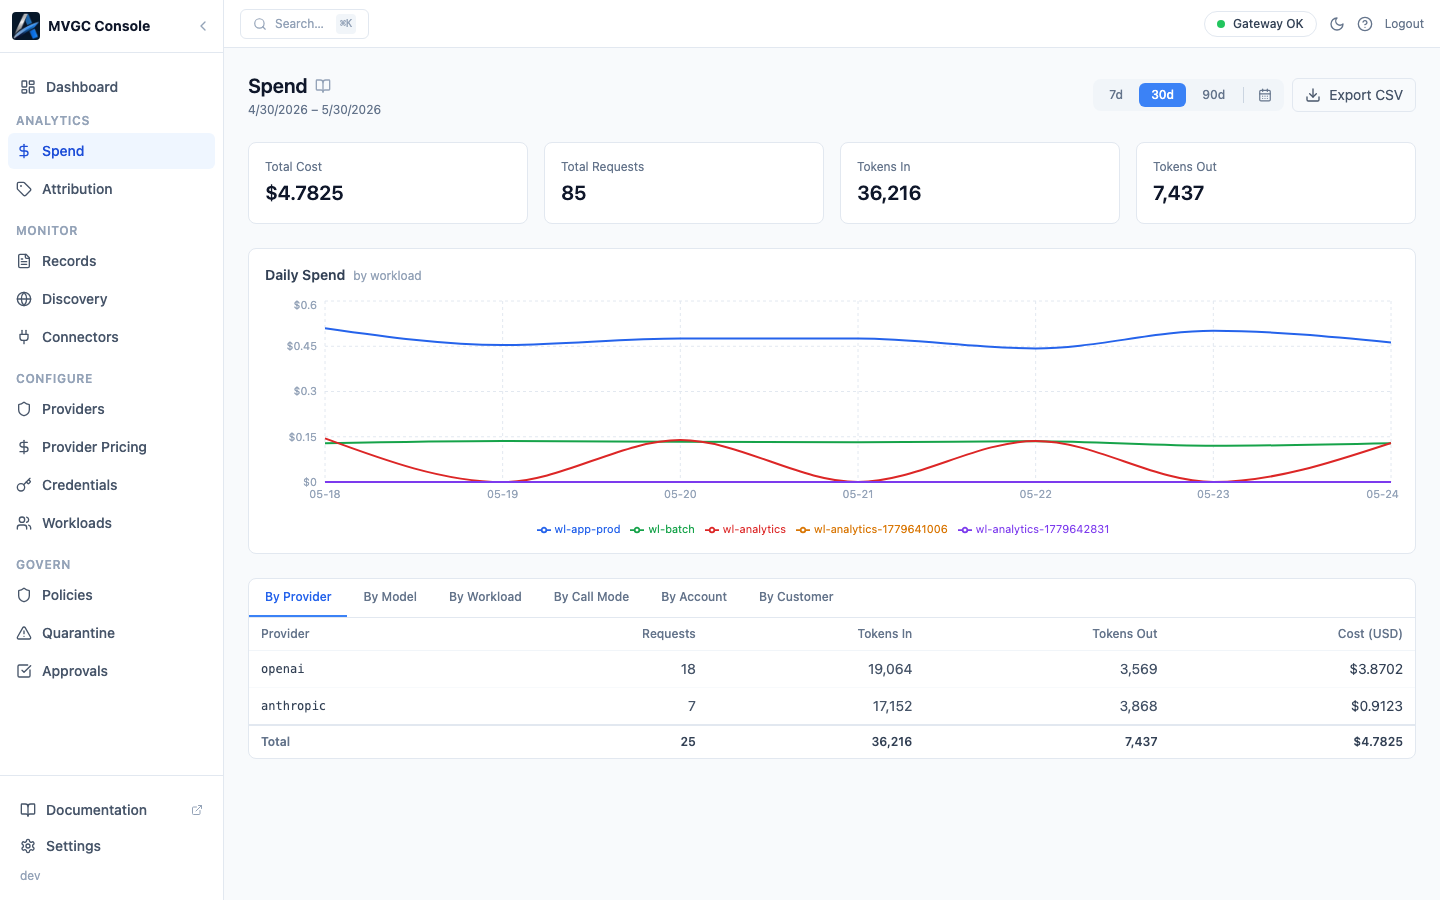
The Spend page breaks down AI cost over a selected period. It uses token counts from execution records and per-model prices from your Provider Pricing table to calculate estimated spend.
How spend is calculated
For each completed request, the gateway multiplies the provider-reported token counts by the input and output prices configured in Provider Pricing:
cost = (tokens_in × price_per_input_token) + (tokens_out × price_per_output_token)
If a model has no price configured, its cost shows as $0.00. Add prices in the Provider Pricing page to get accurate spend tracking.
Period selector
The period selector controls the time window: 7d, 30d, 90d, or MTD (month-to-date). All summary cards and charts update when you change the period.
Summary cards
Four metric cards show totals for the selected period: Total Cost, Total Requests, Tokens In, and Tokens Out.
Daily Spend chart
The Daily Spend chart shows per-day cost over the selected period. When more than one workload is active, each workload is a separate line.
Dimension breakdown
Below the chart, a tab bar breaks down spend by dimension. Select a tab to see the totals table for that view:
| Tab | Groups by |
|---|---|
| By Provider | Provider / connector |
| By Model | Model |
| By Workload | Workload ID |
| By Call Mode | Ingress mode (proxy / transparent) |
| By Account | Attribution account label |
| By Customer | Attribution customer label |
Each table shows the dimension, Requests, Tokens In, Tokens Out, and Cost, with a Totals row at the bottom.
The Account and Customer tabs show an empty state with setup instructions if no attribution data has been recorded for the selected period.
Exporting data
The Export CSV button at the top right downloads a CSV of the spend data for the selected period.